QuarterlyIQ vs. Simply Wall St: Which Is Better for Stock Research and Portfolio Monitoring?
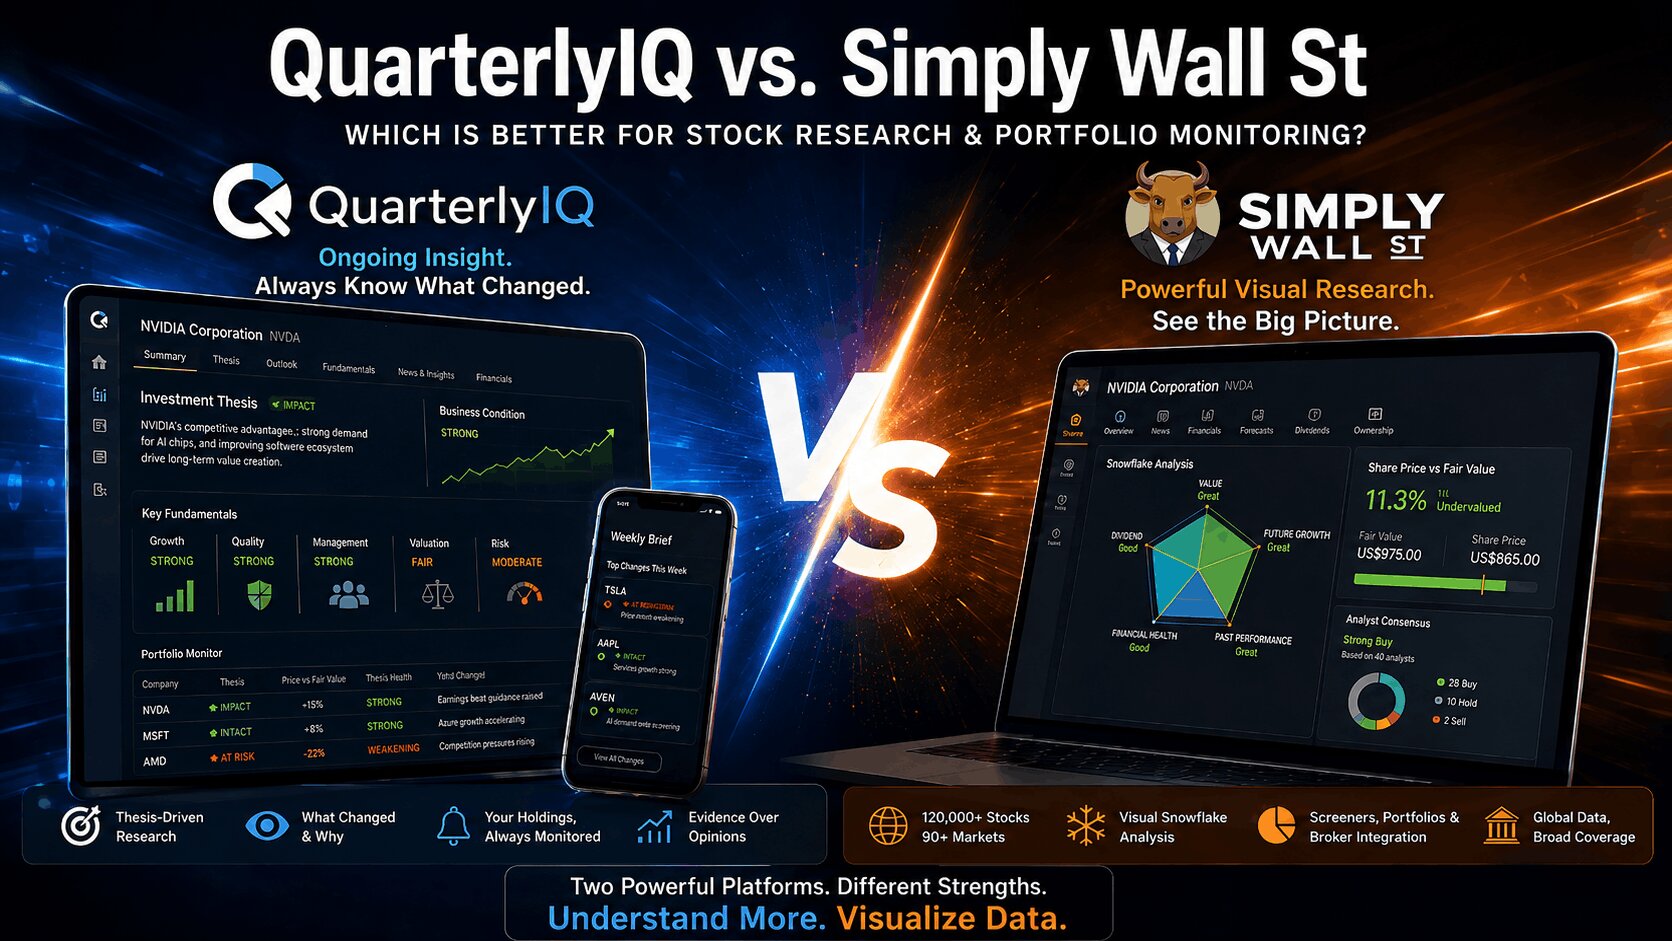
Simply Wall St and QuarterlyIQ are both built for long-term investors who want to understand businesses rather than simply watch stock prices.
At first glance, the products can look similar.
Both provide fundamental stock research. Both analyze valuation, growth, quality and risk. Both offer screeners, portfolios and tools designed to make complicated financial information easier to understand.
But once you spend time with both platforms, an important difference emerges.
Simply Wall St is exceptionally good at organizing an enormous amount of investment data into an accessible visual research and portfolio experience.
QuarterlyIQ is built around maintaining an ongoing analytical view of the companies you own: what the investment case depends on, what the market already expects, what management needs to deliver, what evidence is coming next, and whether anything important has changed.
That distinction matters more than any individual feature.
The Short Answer
Simply Wall St is particularly strong for investors who want enormous global stock coverage, a highly visual research experience, broad screening, detailed transaction-based portfolio performance and extensive brokerage connectivity.
It covers more than 120,000 stocks across 90+ markets and has built one of the most recognizable visual research systems in investing.
QuarterlyIQ takes a more focused approach.
It currently covers 4,000+ stocks and 45+ funds, combining an analyst-style stock Report with a fund-aware Portfolio Manager. Additionally, a user can add a stock outside what is already covered and the platform will start ingesting data on that ticker.
QuarterlyIQ becomes more compelling when your questions sound like:
Is the reason I own this company still intact?
What does today's price already assume?
Is management actually delivering?
What evidence would strengthen or weaken the investment case?
Which holdings across my portfolios actually need my attention?
Those questions get to the heart of how QuarterlyIQ works.
Simply Wall St Has Become Much More Than a Snowflake
Any fair comparison should start by acknowledging how much Simply Wall St does well.
Its signature Snowflake remains one of the most effective visual summaries in fundamental investing.
The Snowflake evaluates a company across five broad dimensions:
Valuation · Future Growth · Past Performance · Financial Health · Dividend
That simplicity has real value. Instead of beginning with pages of financial statements, an investor gets an immediate sense of where a company appears strong or weak.
Simply Wall St has also grown far beyond the Snowflake.
Its platform now combines company research, screening, portfolio analysis, transaction-based return tracking, Smart Updates, user Narratives, valuation tools and brokerage synchronization.
Its global coverage is another major strength. Investors researching companies outside the United States will find a much larger universe on Simply Wall St than on QuarterlyIQ today.
So the interesting question isn't whether Simply Wall St provides serious research.
It clearly does.
The more useful question is:
What kind of research process does each platform help an investor maintain?
The Biggest Difference Is the Research Model
Simply Wall St excels at compressing financial information.
QuarterlyIQ intentionally resists compressing the entire investment case into one score.
The QuarterlyIQ Business Fundamentals framework keeps six important dimensions separate:
Thesis · Growth · Quality · Management · Valuation · Risk
They contribute to a broader view of the business, but they are not interchangeable.
Why does that matter?
A company can simultaneously have excellent business quality, strong management and attractive growth while carrying significant valuation risk.
Management can be executing well while the investment thesis weakens for reasons outside its control.
A stock can decline sharply while nothing important changes in the underlying business.
Conversely, the stock price can remain strong while the investment case quietly deteriorates.
QuarterlyIQ is designed to preserve those distinctions.
You can see how those different dimensions come together in a live QuarterlyIQ company Report.
A stock is not one score. It is a collection of conditions that can improve or deteriorate independently.
QuarterlyIQ Maintains a Standing Investment Case
Simply Wall St increasingly supports investment-thesis thinking through its Narratives system.
Investors can create their own Narrative, record catalysts and risks, adjust assumptions and maintain their own fair-value view over time. Community Narratives add another layer of perspective.
That's useful.
QuarterlyIQ approaches the problem differently.
The investment thesis is part of the research product itself.
For covered companies, QuarterlyIQ can maintain a structured standing thesis together with a thesis-health state and a longer-term Outlook.
That Outlook asks questions such as:
What kind of bet is this?
What's already priced in?
What are the fundamentals likely to do?
What does the investment case hinge on?
What's the bottom line?
That distinction in authorship matters.
With Simply Wall St Narratives, the investor or community author maintains the investment story.
With QuarterlyIQ, the platform maintains an independent research view alongside the investor.
That becomes especially useful when an investment thesis begins to weaken, because the investor doesn't have to remember every assumption from the original research.
“What to Watch” Turns the Thesis Into Something Testable
Most investment platforms are good at telling investors what already happened.
QuarterlyIQ also tries to define what evidence matters before it happens.
Its “What to Watch” framework identifies specific future conditions connected to the investment case.
Critically, those conditions are designed to be falsifiable.
A watch item doesn't merely identify something that might matter. It can also define:
What would confirm the idea
and
What would weaken or disprove it.
Consider the difference.
A conventional system might say:
Watch Intel Foundry progress.
A more useful research condition is closer to:
Watch for evidence of a meaningful external Foundry customer.
Then define what evidence would count as confirmation and what evidence would count against the thesis.
That is a much stronger discipline.
It helps prevent one of the most common behavioral problems in investing: moving the goalposts every time new evidence conflicts with the original thesis.
This is also why price alerts alone are not enough to monitor a portfolio.
Simply Wall St's Smart Updates are broader. They can surface earnings, dividends, estimate revisions, analyst changes, management departures, insider activity and other important events.
QuarterlyIQ's advantage is different.
Simply Wall St is strong at telling you that something happened.
QuarterlyIQ is increasingly designed around understanding what that development means for the investment case.
QuarterlyIQ Doesn't Just Surface News. It Asks Why the News Matters.
Investors don't suffer from a shortage of headlines.
They suffer from a shortage of relevance.
QuarterlyIQ's company-news system is designed around that problem.
Rather than treating every story containing a ticker as equally important, QuarterlyIQ can evaluate material developments against the company's research context and objectives.
A material company development can carry information about whether it advances or threatens an objective, how significant the impact appears to be, the credibility of the source and why the event matters.
QuarterlyIQ separately analyzes material SEC filings such as 8-Ks, 10-Qs and 10-Ks and maintains an importance-ranked record of meaningful changes.
The goal is not to build the largest news feed.
It is to answer a better question:
“Does this development materially change anything I care about?”
Management Research Goes Beyond Who the CEO Is
Both platforms provide management-related information.
Simply Wall St includes management and ownership analysis within its company research, including executive information and insider activity.
QuarterlyIQ focuses more heavily on execution.
Its Quality research combines business-quality analysis with a management execution scorecard and management priorities.
That turns management research into questions such as:
What is management trying to accomplish?
How credible has its guidance been?
Is execution improving or deteriorating?
Are current developments helping or hurting the objectives management has laid out?
This is closer to maintaining a scorecard than maintaining a management biography.
For a long-term investor, that's a meaningful distinction.
Earnings Analysis Goes Beyond the Calendar
QuarterlyIQ's Earnings research deserves more attention than a traditional earnings-calendar feature.
The system can examine a company's own reporting history together with recent results from sector peers to create a next-print fundamental lean.
That can include the company's recent beat track record, an indicative beat probability, how recently reporting peers have performed, management's standing guidance and the evidence behind the conclusion.
QuarterlyIQ separately maintains a miss-risk view based on company history and industry base rates.
These are deliberately not predictions about the stock price.
A company can beat expectations and still see its shares fall because investors had already anticipated an even larger beat.
That's why it helps to understand what actually moves a stock before earnings.
QuarterlyIQ is asking:
“What does the fundamental setup suggest about the next report?”
not:
“Will the stock go up after earnings?”
That distinction runs throughout the product.
Valuation: Both Platforms Are Serious, but They Ask Different Questions
Simply Wall St has a substantial valuation toolkit.
Its methodology incorporates intrinsic and relative approaches, with valuation models selected based on the characteristics of the business. Its Narratives and Valuator also let investors create their own assumptions and fair-value estimates.
QuarterlyIQ approaches valuation from several directions simultaneously.
Depending on the company, its current framework can draw from methods including:
Peer P/E · Peer EV/EBITDA · Peer P/S · Peer P/FCF · Own P/E History · PEG · Management Guidance · Peer P/B · Peer P/FFO · Peer EV/Sales
Those methods can be considered across multiple horizons and with different confidence levels.
But method count isn't what makes the QuarterlyIQ approach interesting.
Two other questions matter more.
1. What is already priced in?
QuarterlyIQ explicitly asks what expectations are embedded in the current stock price.
That changes the valuation question from:
“Is this stock expensive?”
to:
“What has to go right for today's price to make sense?”
Understanding what “priced in” really means is critical because valuation and business quality are not the same thing.
A great company can still become a fragile investment when investors already expect years of exceptional growth and execution.
Likewise, a less exciting company can become interesting when expectations fall far enough.
That's why simply asking whether a P/E ratio looks high or low is rarely enough. A better approach is understanding whether a stock may be overvalued without relying on one magic ratio.
2. QuarterlyIQ can refuse to publish a consensus fair value
This may sound like a limitation.
We think it is a strength.
When underlying valuation methods disagree too widely or the evidence doesn't support a defensible consensus, QuarterlyIQ can withhold the overall fair-value estimate rather than manufacturing confidence.
The individual method outputs can still be reviewed.
The disagreement itself becomes information.
That reflects a principle we've written about before:
Fair value is a range, not a precise number.
Sometimes the most useful answer a research system can give is:
“The evidence isn't coherent enough to stand behind one number yet.”
Risk Means More Than Volatility
Traditional investment tools often define risk through price statistics such as volatility, beta, drawdowns and correlations.
Those measures matter.
QuarterlyIQ calculates them too.
But they are only one type of risk.
The QuarterlyIQ research framework can also connect risk to thesis condition, valuation expectations, earnings, macro sensitivities, sector conditions and future evidence that could weaken the investment case.
That distinction matters because price movement and business deterioration are not the same thing.
A low-volatility company can still be risky if its valuation depends on unrealistic future execution.
A volatile stock can represent a fundamentally healthy business whose market price simply moves around a lot.
We've explored this distinction in more detail in Stock Price Down, Business Intact: How to Tell the Difference.
QuarterlyIQ tries to show both forms of risk.
Portfolio Management Is Where the Products Separate Most Clearly
Simply Wall St has become a genuinely strong portfolio-management platform.
Its transaction-based portfolio can provide detailed historical performance, capital gains, dividends, benchmarking and other return analytics.
If your primary portfolio question is:
“Exactly how has my money performed?”
Simply Wall St currently has the more mature transaction-accounting system.
QuarterlyIQ's Portfolio Manager is designed around another question:
“What inside my portfolio deserves my attention?”
The portfolio experience can bring together holdings, performance context, thesis-health problems, upcoming earnings, recent material developments, dividend concerns, risk versus the S&P 500, sector exposure and effective underlying holdings.
That turns the portfolio from a ledger into more of a research triage system.
For someone with 20 or 30 holdings across multiple accounts, this can be extremely useful.
You rarely need to research all 30 companies today.
You need to know which two or three deserve another look.
You can explore the approach directly through the QuarterlyIQ sample portfolio.
QuarterlyIQ Connects the Economy to What You Actually Own
QuarterlyIQ also takes an unusual approach to macroeconomic research.
The platform contains significant economic and sector data, but macro is deliberately treated as supporting context rather than the core product.
Its more useful role is connecting the economic environment back to the portfolio.
At the portfolio level, QuarterlyIQ can examine the current macro backdrop against sector exposure and identify where forces such as rates, inflation or growth may be acting as tailwinds or headwinds.
The distinction is important.
Financial media tells investors:
Interest rates are rising.
Or:
Inflation is cooling.
The investor's real question should be:
“Why does that matter to what I own?”
QuarterlyIQ is designed to connect those two layers.
Fund Look-Through Changes What “My Portfolio” Means
Suppose an investor owns five stocks, an S&P 500 ETF, a technology ETF, a dividend ETF and several mutual funds.
At the ticker level, that might look like nine investments.
Economically, that investor may own pieces of hundreds or thousands of businesses, with substantial overlap between them.
QuarterlyIQ can look through supported funds and identify the underlying company exposure.
It can then apply company-level research context to those indirect holdings.
That creates an important distinction.
A company's thesis may weaken even though you never purchased that company directly.
You may still own it through several ETFs.
Likewise, what looks like a diversified collection of funds can hide substantial concentration in the same underlying businesses.
QuarterlyIQ also uses fund exposure to improve portfolio sector analysis rather than treating the entire ETF as an opaque ticker.
The goal is to analyze the portfolio closer to what you economically own, not merely the symbols displayed on a brokerage statement.
Dividends and Taxes Add Another Portfolio Layer
Simply Wall St provides substantial dividend analysis, including yield, dividend quality and portfolio income information.
QuarterlyIQ also incorporates income analysis into the portfolio.
It can calculate projected dividend income, current yield, yield on cost and upcoming payout timing. Dividend deterioration can also contribute to the portfolio's attention view.
For taxable portfolios, QuarterlyIQ adds a separate tax-aware layer around unrealized gains and losses, holding periods and potential tax-loss-harvesting situations where the necessary data is available.
This is not a replacement for professional tax planning.
It reinforces the broader product philosophy:
Portfolio analytics should surface issues an investor may actually need to review, not simply produce more charts.
Brokerage Connectivity: Simply Wall St Wins on Breadth
QuarterlyIQ supports importing and connecting portfolio holdings so that research can be applied to the investor's actual book.
But Simply Wall St has a clear advantage in connectivity breadth.
It advertises synchronization with more than 2,000 brokers, and its transaction-based infrastructure is more mature for reconstructing historical portfolio performance.
That's a legitimate Simply Wall St advantage.
The products are solving somewhat different problems with that data.
Simply Wall St uses brokerage data extensively to improve portfolio accounting and return measurement.
QuarterlyIQ is more focused on using holdings data to determine which underlying investments require research attention.
Screening: Breadth vs. Research Context
Simply Wall St also has the advantage in sheer discovery breadth.
Its stock screener searches across a huge global universe and offers a mature selection of valuation, growth, profitability, ownership and other filters.
QuarterlyIQ's stock screener is narrower because its covered universe is narrower.
But it reflects the same analytical framework used by the Report.
Investors can screen using concepts related to overall business condition, Growth, Quality, Management, Valuation, Risk, Thesis, market cycle, fair-value gap and macro sensitivity.
That creates continuity.
Instead of discovering a company through one arbitrary collection of filters and then opening a completely different research framework, the screener and Report speak the same language.
Simply Wall St wins on breadth and screening maturity.
QuarterlyIQ's advantage is continuity between discovery, research and monitoring.
Daily Updating Alone Isn't the Differentiator
QuarterlyIQ rebuilds its analyst-style Reports every market day.
Simply Wall St also updates company research frequently, with many underlying datasets updated as new information becomes available.
So “updated daily” by itself isn't the real competitive advantage.
The difference is what the refresh is trying to maintain.
QuarterlyIQ's research engine feeds business fundamentals, thesis condition, valuation, risk, material developments and portfolio attention.
Its longer-term Outlook provides another layer: a durable view of the investment case that doesn't need to change merely because the market had another trading day.
That separation between:
“What changed today?”
and
“What changed in the investment case?”
is closer to how an analyst should actually work.
QuarterlyIQ vs. Simply Wall St at a Glance
| Capability | QuarterlyIQ | Simply Wall St | Current Edge |
|---|---|---|---|
| Global coverage | 4,000+ stocks and 45+ funds | 120K+ stocks across 90+ markets | Simply Wall St |
| Fast visual company scan | Business Fundamentals framework | Excellent Snowflake experience | Simply Wall St |
| Fundamental company research | Analyst-style Report | Deep visual company report | Different approaches |
| Standing investment thesis | Platform-maintained thesis + Outlook | Investor/community Narratives | QuarterlyIQ |
| Falsifiable watch conditions | Explicit confirmation/disproof evidence | Broad Smart Updates | QuarterlyIQ |
| News relevance | Evaluated against company objectives and research context | Broad categorized updates | QuarterlyIQ for context |
| Management execution | Execution scorecard + priorities | Management analysis | QuarterlyIQ |
| Earnings setup | Guidance history + beat/miss fundamental framework | Earnings and forecast analysis | QuarterlyIQ |
| Valuation | Multi-method + priced-in expectations + confidence/abstention | Strong intrinsic/relative valuation + custom Valuator | Different strengths |
| Financial statements | Annual and quarterly statements | Extensive financial history | Comparable core capability |
| Risk | Thesis + valuation + earnings + macro + market risk | Risks & Rewards + portfolio risk | QuarterlyIQ for context |
| Portfolio return accounting | Useful holdings and P&L analytics | Mature transaction-based engine | Simply Wall St |
| Broker connectivity | Portfolio importing/connectivity | 2,000+ advertised connections | Simply Wall St |
| Portfolio attention | Thesis health + events + earnings + risk | Smart Updates + portfolio insights | QuarterlyIQ |
| Macro-to-portfolio analysis | Explicit holdings-based macro context | Broader diversification analytics | QuarterlyIQ |
| Fund look-through | Underlying company exposure + research | Portfolio diversification analysis | QuarterlyIQ |
| Dividend analysis | Income + yield + payout timing + health | Mature dividend analytics | Both strong |
| Tax-aware portfolio view | Gain/loss and tax-aware review | Transaction reporting | QuarterlyIQ |
| Screener | Business-condition and research framework | Massive global universe | Simply Wall St for breadth |
| Ownership & insiders | Still expanding | Established analysis | Simply Wall St |
Where Simply Wall St Is Better
There are several cases where we would choose Simply Wall St.
If you primarily invest outside the United States, its global universe is dramatically larger.
If you want to understand hundreds of companies quickly, the Snowflake remains an exceptionally efficient visual research system.
If transaction-level portfolio accounting, historical return measurement or very broad brokerage synchronization is your priority, Simply Wall St is currently more mature.
And investors who value community-created Narratives, insider information and broad discovery tools will find significant advantages there.
There is no reason to minimize those strengths.
Where QuarterlyIQ Is Better
QuarterlyIQ becomes more differentiated as the investor moves from:
“What stock should I research?”
to:
“I own this company. Now help me stay on top of it.”
Its strengths become clearer when you want to know:
Is the thesis still intact?
What is already priced into the shares?
What must remain true?
What evidence would prove the investment case wrong?
Is management delivering?
What is the setup going into the next earnings report?
Did this news actually affect an important company objective?
Which holdings across my portfolios deserve attention?
What businesses am I really exposed to through my funds?
How does today's macro environment intersect with what I own?
Those aren't disconnected features.
They are parts of the same research process.
That is where QuarterlyIQ's design becomes most compelling.
So Which Is Better: QuarterlyIQ or Simply Wall St?
If the question is:
Which platform covers more stocks, markets and brokers?
Simply Wall St wins.
If the question is:
Which platform gives me the fastest visual understanding of almost any public company around the world?
Simply Wall St is extremely difficult to beat.
If the question is:
Which platform has the more mature transaction-based portfolio accounting system today?
Again, Simply Wall St.
But those aren't the only problems long-term investors have.
After you buy a company, the job changes.
You now have to remember why you bought it.
Understand what the valuation requires.
Judge whether management is executing.
Know which evidence matters.
Recognize when the thesis changes.
Separate meaningful developments from noise.
Understand the hidden businesses inside your funds.
And decide which of dozens of holdings actually deserve your attention.
That is the problem QuarterlyIQ is designed around.
Simply Wall St has built an exceptional platform for seeing and organizing investment information.
QuarterlyIQ is more specialized around maintaining an informed view of the investments you actually own.
For broad global discovery, highly visual research and detailed transaction tracking, we would choose Simply Wall St.
For ongoing fundamental research, investment-case monitoring and understanding what actually changed across a portfolio, we believe QuarterlyIQ is the stronger product.
Not because it has more data.
Because it is increasingly better at answering the question that matters after the initial research is finished:
What changed, why does it matter, and do I still believe what I believed when I bought this company?
Explore More QuarterlyIQ Comparisons
If you're evaluating investment research and portfolio-monitoring platforms, you may also find these comparisons useful:
QuarterlyIQ vs. Seeking Alpha: Which Is Better for Portfolio Monitoring and Stock Research?
QuarterlyIQ vs. Stock Rover: Which Is Better for Stock Research and Portfolio Monitoring?
QuarterlyIQ vs. Guardfolio: Which Portfolio Monitoring Platform Is Better?
You can also explore QuarterlyIQ's stock research, view a sample portfolio, or compare QuarterlyIQ plans.
Disclosure: This comparison is published by QuarterlyIQ. We have an obvious interest in the outcome, so we have deliberately identified areas where Simply Wall St currently has stronger capabilities. Simply Wall St features were reviewed using its publicly available product and support information. Product capabilities can change. QuarterlyIQ provides descriptive investment research and portfolio monitoring, not personalized investment advice or buy/sell recommendations.