How to Read the Expectations Embedded in a Stock Price
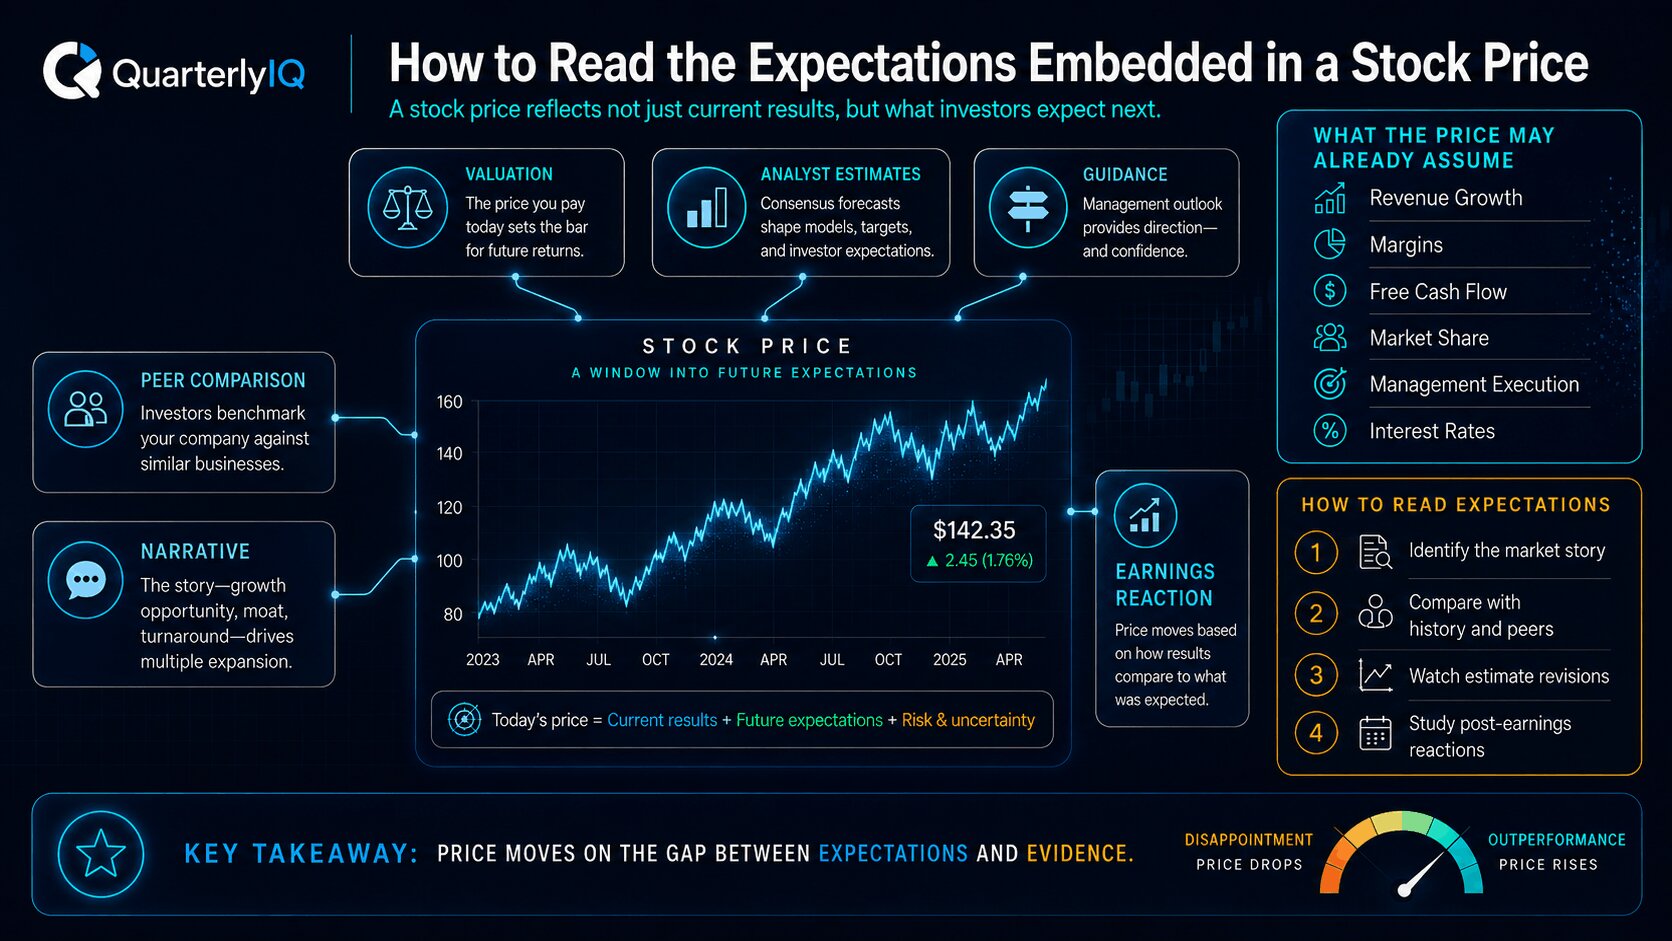
A stock price is not only a judgment about what a company is today.
It is also a judgment about what investors expect the company to become.
That is what makes investing difficult.
Two companies can report similar results and receive very different market reactions. One stock may rise because the results were better than feared. Another may fall because strong results were still not strong enough.
The difference often comes down to expectations.
A stock price can already reflect assumptions about growth, margins, cash flow, customer demand, competition, interest rates, management execution, and future valuation. Those assumptions may be reasonable. They may be too optimistic. They may be too pessimistic.
The challenge is learning how to read them.
You cannot know the market’s exact expectations with perfect precision. But you can build a useful picture by studying valuation, estimates, business performance, peer comparisons, and how the stock reacts to new information.
That process can help you understand what the current price may require from the company next.
A stock price is a bundle of expectations
A stock price reflects what investors are willing to pay today for a company’s expected future results.
Those expected results may include:
- Revenue growth
- Profit margins
- Free cash flow
- Customer retention
- Market share
- New products
- Competitive strength
- Management execution
- Balance-sheet strength
- Interest-rate sensitivity
- Business risk
- Long-term durability
The current price is not simply saying, “This company is good” or “This company is bad.”
It is closer to saying, “Based on what investors currently believe, this stream of future results is worth this much today.”
That is why the same business result can mean different things at different prices.
A company growing revenue 20 percent may look attractive if the stock price assumed 10 percent growth.
The same 20 percent growth may disappoint if the stock price assumed 30 percent growth.
The business result is the same.
The expectation behind the stock is different.
Start with the market story
Every stock has some kind of prevailing story.
Sometimes the story is obvious. Sometimes it is hidden inside valuation and analyst estimates.
The market may be pricing a company around:
- Rapid growth
- A margin recovery
- A turnaround
- A new product cycle
- Artificial intelligence demand
- Cost cuts
- International expansion
- A cyclical rebound
- A regulatory approval
- A durable compounder story
- A slow decline
- Financial distress
The first step is to identify what investors appear to believe.
Ask:
- Why do people currently own this stock?
- What is the optimistic case?
- What is the skeptical case?
- Which metrics does the market seem to care about most?
- What would surprise investors?
- What would disappoint them?
- Has the story changed recently?
The story does not tell you whether the stock is attractive.
It tells you what kind of evidence the market is likely to reward or punish.
A stock priced around rapid growth will be judged differently from a stock priced around stabilization. A stock priced around a turnaround will be judged differently from a stock priced around flawless execution.
Look at the valuation for clues
Valuation is one of the clearest places to begin reading expectations.
A high valuation often suggests that investors expect strong future performance.
A low valuation often suggests that investors see risk, uncertainty, or weaker future results.
But the ratio alone does not explain enough.
A high P/E ratio may reflect:
- Fast earnings growth
- Durable competitive advantages
- High margins
- Predictable revenue
- Strong returns on capital
- Low financial risk
- Temporarily depressed earnings
- Investor optimism that may be excessive
A low P/E ratio may reflect:
- Slowing growth
- Cyclical peak earnings
- Falling margins
- Debt risk
- Customer weakness
- Management concerns
- Low confidence in future cash flow
- Investor pessimism that may be excessive
The number is a clue, not a conclusion.
The useful question is:
What would the company need to deliver for this valuation to make sense?
For more on this, read High P/E Does Not Always Mean Overvalued.
Compare the valuation with the company’s own history
A stock’s current valuation may look high or low compared with the market, but its own history can provide additional context.
Ask:
- Is the stock trading above or below its historical range?
- What was happening when it traded at similar levels before?
- Were growth rates higher or lower then?
- Were margins expanding or contracting?
- Were estimates rising or falling?
- Were interest rates different?
- Was the business more predictable or less predictable?
- Was the competitive position stronger or weaker?
A stock trading near the high end of its historical valuation range may suggest investors expect unusually strong performance or lower risk.
A stock trading near the low end may suggest investors expect weaker growth, lower confidence, or a more difficult environment.
History does not define fair value.
A company can deserve a higher valuation than it used to if the business has improved. It can deserve a lower valuation if the business has weakened.
The goal is to understand what changed.
Compare the stock with peers
Peer comparison can help reveal what the market believes about a company relative to similar businesses.
Compare:
- Revenue growth
- Earnings growth
- Margins
- Free cash flow
- Balance-sheet strength
- Customer retention
- Market share
- Competitive position
- Estimate revisions
- Valuation multiples
A company may trade at a premium because investors believe it has stronger growth, better margins, lower risk, or more durable earnings than peers.
That premium may be justified.
It may also be too generous.
Ask:
- Is the premium supported by better business evidence?
- Are estimates rising faster than peers?
- Is the company gaining share?
- Are margins structurally better?
- Is cash flow stronger?
- Is the business less cyclical?
- Is the valuation gap widening faster than the performance gap?
The key is not whether one company is more expensive than another.
The key is whether the more expensive company is expected to deliver meaningfully better results.
Read analyst estimates as expectation markers
Analyst estimates are not perfect, but they are useful markers of expected performance.
They can show what investors are broadly preparing for in revenue, earnings, margins, and cash flow.
Pay attention to:
- Current-year revenue estimates
- Next-year revenue estimates
- Earnings estimates
- Margin assumptions
- Free cash flow expectations
- Long-term growth expectations
- The direction of revisions
- The spread between optimistic and cautious estimates
The direction matters more than one number.
A company with rising estimates may be earning greater confidence.
A company with falling estimates may be facing weaker expectations.
A stock becomes more interesting, or more fragile, when price and estimates move in different directions.
For example:
- Price rising while estimates rise may reflect improving fundamentals
- Price rising while estimates stay flat may reflect multiple expansion
- Price falling while estimates stay stable may reflect valuation compression
- Price falling while estimates fall may reflect deteriorating expectations
- Price staying high while estimates fall may create valuation risk
The relationship between price and estimates often says more than either one alone.
Watch what the stock does after earnings
Earnings reactions can reveal what investors expected before the report.
A company can beat estimates and still fall.
That may indicate:
- The beat was already expected
- Guidance disappointed
- Margins were weaker than the headline
- Growth quality deteriorated
- Investors wanted a larger beat
- The valuation left little room for anything less than exceptional results
A company can miss estimates and still rise.
That may indicate:
- Investors feared worse
- Guidance was reassuring
- Cash flow was better than expected
- The weak results were viewed as temporary
- A major uncertainty was removed
- The valuation already reflected pessimism
The stock reaction is not a perfect verdict.
Short-term trading can be noisy.
But the reaction can help you identify which expectations mattered most.
If a stock falls despite good headline numbers, look for the assumption that was challenged.
If a stock rises despite weak headline numbers, look for the fear that was relieved.
For a deeper explanation, read What Does “Priced In” Mean in the Stock Market?.
Separate the headline number from the expectation
Investors often focus on the headline:
Revenue beat.
EPS missed.
Guidance raised.
Margins compressed.
But the market usually reacts to the difference between the headline and the expectation.
A company can raise guidance and still disappoint if the market expected a larger raise.
A company can report margin pressure and rise if investors expected worse pressure.
A company can grow quickly and fall if growth is slowing faster than expected.
A company can report weak earnings and rise if cash flow or bookings suggest stabilization.
The headline tells you what happened.
The reaction helps show what investors expected.
The analysis begins when you compare the two.
Identify the required performance
One of the most useful ways to read expectations is to ask what performance the stock price seems to require.
Depending on the company, that may include:
- Revenue growth above a certain level
- Earnings growth accelerating
- Margins expanding
- Customer retention staying high
- New products becoming material
- Free cash flow improving
- Debt declining
- Market share increasing
- Competition remaining manageable
- Management meeting long-term targets
A stock trading at a demanding valuation may need several of these things to happen at once.
That does not mean the stock is automatically overvalued.
It means the company has less room for disappointment.
A stock may struggle even if the business performs well, if the business does not perform well enough to support the embedded expectations.
This is one reason great companies can still become fragile investments.
For more on that distinction, read Why Great Companies Can Still Be Fragile Investments.
Look for the expectation gap
An expectation gap appears when the current price assumes one path while the evidence begins pointing to another.
The gap may be positive or negative.
Positive expectation gap
The market may be too pessimistic if:
- The stock trades at a depressed valuation
- Estimates have already been reduced
- Investors expect weak results
- The company shows signs of stabilization
- Cash flow remains stronger than feared
- Management guidance becomes more credible
- Competitors are not gaining as much ground as expected
In this case, the company does not need to be perfect.
It may only need to be better than feared.
Negative expectation gap
The market may be too optimistic if:
- The stock trades at a high valuation
- Estimates assume strong growth
- Margins need to expand
- Investors expect flawless execution
- Revenue growth is slowing
- Estimates stop rising
- Competition begins to pressure the business
- Management guidance becomes less reliable
In this case, the company does not need to fail.
It may only need to deliver less than hoped.
The expectation gap is where much of valuation risk and opportunity begins.
Read expectations through valuation ranges
A single fair value number can make expectations look more precise than they are.
A better approach is to think in ranges.
Ask what the stock might be worth under:
- A conservative case
- A base case
- An optimistic case
Then compare the current price with those scenarios.
If the stock trades near your conservative case, the market may already be pricing in a difficult outcome.
If it trades near your base case, expectations may be more balanced.
If it trades near your optimistic case, the price may already require a lot to go right.
This does not prove the market is wrong.
It helps you see what kind of future the current price may already assume.
For a fuller framework, read Fair Value Is a Range, Not a Precise Number.
Watch whether estimates support the valuation
A high valuation is easier to understand when estimates are moving higher.
It becomes more fragile when the valuation remains elevated while estimates flatten or fall.
Ask:
- Are revenue estimates rising?
- Are earnings estimates rising?
- Are margin expectations improving?
- Is free cash flow expected to grow?
- Are long-term growth assumptions being raised?
- Are estimate increases broad or limited to one period?
- Are revisions supported by company results?
A stock can become vulnerable when investors continue paying a premium for a company whose expected path is no longer improving.
The price may still reflect the old story while estimates begin reflecting a less exciting future.
That mismatch is worth watching.
Consider what expectations are built into guidance
Management guidance often becomes a key reference point for expectations.
The market may evaluate a company against:
- Quarterly guidance
- Full-year guidance
- Long-term targets
- Margin goals
- Revenue growth targets
- Product adoption milestones
- Cash flow commitments
- Capital allocation plans
When a company guides investors toward a specific path, that path can become part of the price.
If management raises guidance, investors may increase expectations.
If management lowers guidance, investors may reduce them.
But the reaction depends on what the market expected before the guidance arrived.
A guidance raise can disappoint if investors expected an even larger raise.
A guidance cut can be forgiven if investors already feared something worse.
Guidance matters most when it changes the expected path of the business.
Study the assumptions behind the multiple
A valuation multiple is shorthand for many assumptions.
A high multiple may imply that investors believe:
- Growth will remain strong
- Margins will expand
- Earnings will be durable
- Cash flow will improve
- Risk is relatively low
- The company deserves a premium
- The business can compound for many years
A low multiple may imply that investors believe:
- Growth will slow
- Earnings are vulnerable
- Margins may compress
- Cash flow is uncertain
- The business is cyclical
- Debt or financial risk matters
- Management credibility is lower
The multiple does not explain which assumption matters most.
You need to connect it to the business.
A software company with a high multiple may depend on retention and margin expansion.
A bank with a low multiple may reflect credit risk or interest-rate sensitivity.
A retailer may depend on inventory, traffic, and gross margin.
An industrial company may depend on orders, backlog, and operating leverage.
Each stock has its own expectation map.
Observe what the market ignores
Sometimes expectations can be read by watching what investors do not react to.
A stock may stop falling on bad news because the bad news is already expected.
A stock may stop rising on good news because the good news is already assumed.
A company may announce a positive development and see little reaction because investors were already focused on a different issue.
For example:
- Revenue growth may matter less if margins are the concern
- EPS may matter less if cash flow is weak
- New products may matter less if customer retention is falling
- Cost cuts may matter less if demand is deteriorating
- Strong past results may matter less if guidance weakens
The market often has a primary question in mind.
Reading expectations means identifying that question.
Watch for narrative shifts
Expectations are not built only through spreadsheets.
They are also built through narratives.
A stock may be priced around a story such as:
- This company is becoming the category leader
- This is a durable compounder
- This is a margin expansion story
- This is a turnaround
- This is an AI beneficiary
- This is a recovery play
- This is a value trap
- This company is losing relevance
Narratives can change faster than reported results.
When the narrative changes, the valuation can change too.
A company once valued for growth may begin being valued for cash flow.
A company once valued for stability may begin being valued as cyclical.
A company once viewed as a leader may begin being viewed as vulnerable.
The business evidence may change gradually.
The narrative can reprice quickly.
That is why investors should track both the numbers and the story investors appear to be telling about those numbers.
Read expectations through time horizon
Different stocks are priced around different time horizons.
A mature company may be valued mostly on earnings expected over the next year or two.
A high-growth company may be valued on earnings several years in the future.
A turnaround may be valued on whether results will improve from depressed levels.
A biotech or early-stage technology company may be valued around a future event that has not yet reached the income statement.
The longer the time horizon, the more sensitive the stock may be to changes in assumptions.
Small changes in expected growth, margins, timing, or risk can have a large impact when most of the value depends on the future.
Ask:
- How much of the valuation depends on results far in the future?
- What milestones need to happen before those results become visible?
- What evidence would shorten or extend the timeline?
- Is the company funded well enough to reach that future?
- Are investors becoming more or less willing to wait?
Time is part of the expectation.
A right thesis at the wrong pace can still disappoint.
Watch interest rates and discount rates
Interest rates can change what investors are willing to pay for future earnings.
When rates are low, investors may pay higher valuations for companies expected to earn more later.
When rates rise, those future earnings may become less valuable in present terms.
That can affect the expectations embedded in a stock price even if the company itself is still performing well.
High-growth stocks and long-duration businesses can be especially sensitive.
The company may continue growing, but the valuation multiple may compress because investors demand a higher return.
This is not always a business problem.
Sometimes it is a pricing problem.
A full expectation read should include the market environment, not only company-specific results.
Distinguish business expectations from valuation expectations
A stock price can change because business expectations changed.
It can also change because valuation expectations changed.
Business expectations changed
This may happen when:
- Growth outlook improves or deteriorates
- Margins change
- Customers behave differently
- Competition shifts
- Management changes guidance
- Estimates are revised
- Cash flow improves or weakens
Valuation expectations changed
This may happen when:
- Interest rates move
- Investors demand a higher return
- A sector falls out of favor
- Risk appetite changes
- Peer multiples compress
- Market sentiment shifts
Both matter.
A stock can fall because the business is weakening.
It can also fall because investors are no longer willing to pay the same multiple for the same business.
For more on separating those situations, read Stock Price Down, Business Intact: How to Tell the Difference.
Use price reaction as a question, not an answer
A stock’s reaction to news can be informative, but it should not replace analysis.
A sharp move tells you that something changed in investor perception.
It does not tell you exactly what changed.
When a stock reacts strongly, ask:
- What happened?
- What did investors likely expect?
- Which metric drove the reaction?
- Did guidance change?
- Did estimates change?
- Did valuation change?
- Was the reaction company-specific or market-wide?
- Which part of the thesis is affected?
- What evidence should be watched next?
The price movement opens the investigation.
It should not complete it.
A practical framework for reading embedded expectations
You can use the following process to read expectations more clearly.
1. Identify the prevailing story
What do investors appear to believe about the company?
Is it a growth story, margin story, turnaround story, recovery story, quality story, or risk story?
2. Review the valuation
What does the current valuation suggest investors may be assuming about growth, profitability, risk, and durability?
3. Compare with history and peers
Is the stock trading at a premium or discount to its own past and to similar companies?
Is that premium or discount supported by business evidence?
4. Study estimate revisions
Are revenue, earnings, margins, and cash flow estimates moving higher or lower?
Are expectations improving or deteriorating?
5. Read guidance carefully
What path has management described?
Is the company raising, maintaining, or lowering expectations?
6. Observe earnings reactions
Did the stock react positively or negatively to results?
Was the reaction driven by the headline number, guidance, margins, cash flow, or something else?
7. Define required performance
What does the company need to deliver for the current price to make sense?
8. Compare price with a fair value range
Is the stock trading near a conservative, base, or optimistic scenario?
9. Watch for narrative shifts
Has the market started telling a different story about the company?
10. Update the investment thesis
Ask whether the evidence still supports the expectations embedded in the price.
This framework will not produce certainty.
It can help you avoid treating price, valuation, or earnings reactions as isolated signals.
Common mistakes when reading expectations
Assuming a good company means a good setup
A company can be excellent while the stock is priced for too much.
Business quality matters, but it must be compared with expectations.
Treating low valuation as automatic pessimism
A low valuation may reflect excessive fear. It may also reflect a real deterioration in the business.
The reason for the discount matters.
Looking only at consensus estimates
Published estimates are useful, but the effective market expectation may be higher or lower than consensus.
Recent stock performance, valuation, investor positioning, and narrative matter too.
Ignoring the direction of revisions
The direction of expectations often matters more than the current estimate.
A company with falling estimates may be becoming more fragile even if the headline valuation still looks reasonable.
Confusing price movement with proof
A stock rise does not prove the thesis is right.
A stock decline does not prove the thesis is broken.
Price movement needs to be connected to evidence.
Forgetting that expectations change
The stock you bought six months ago may not be priced around the same assumptions today.
A strong rally, estimate cuts, margin changes, or sector rotation can change the setup.
How this connects to monitoring after you buy
Expectations are not fixed at the moment of purchase.
They evolve.
A stock may become more attractive if the business improves faster than the price reflects.
It may become more fragile if the price rises faster than the evidence.
It may become less risky if pessimism is already reflected and the business begins stabilizing.
It may become more risky if estimates fall while the valuation remains elevated.
That is why monitoring should include both company performance and market expectations.
A strong monitoring process asks:
- What changed in the business?
- What changed in expectations?
- What changed in valuation?
- What changed in the thesis?
- What evidence should be watched next?
For a broader process, read How to Monitor a Stock After You Buy It.
Why this becomes difficult across a portfolio
Reading embedded expectations for one stock takes work.
Doing it across an entire portfolio is much harder.
Each holding may be priced around a different story.
One may depend on rapid growth.
Another may depend on margin recovery.
Another may reflect pessimism.
Another may depend on lower interest rates.
Another may be priced for a new product or turnaround.
A portfolio can look diversified by ticker while being concentrated in the same expectation risk.
Several holdings may all depend on:
- High valuation multiples
- Strong growth continuing
- Lower interest rates
- Margin expansion
- Investor willingness to pay for long-duration earnings
- Optimistic assumptions about future demand
A portfolio review should not only ask what companies you own.
It should ask what expectations you own.
How QuarterlyIQ approaches embedded expectations
QuarterlyIQ helps investors connect stock prices, business evidence, valuation, and investment theses.
For covered companies, we focus on questions such as:
- What does the current price appear to assume?
- Is the company delivering enough to support those assumptions?
- Are estimates moving higher or lower?
- Is valuation becoming more demanding or less demanding?
- Which part of the thesis is most sensitive to expectations?
- How much room appears to remain for disappointment?
- What evidence should be watched next?
The purpose is not to predict the next stock movement.
It is to help investors understand the expectations surrounding the companies they own and research.
Explore the QuarterlyIQ stock research section to review covered companies.
The takeaway
A stock price is not just a reflection of current results.
It is a reflection of expectations.
Those expectations may involve growth, margins, cash flow, customer behavior, competition, interest rates, management execution, and investor confidence.
To read them, look beyond the headline price.
Study the valuation. Compare the company with peers. Follow estimate revisions. Watch earnings reactions. Identify the prevailing story. Ask what performance the price appears to require.
Most importantly, compare expectations with evidence.
A stock can be priced for too much optimism.
It can also be priced for too much pessimism.
The work is understanding which one is more likely.
The better you can read the expectations embedded in a stock price, the better you can understand what the market may already be assuming and what the company needs to prove next.
For more on expectations and valuation, read What Does “Priced In” Mean in the Stock Market?.
For a broader valuation framework, read How to Tell if a Stock Is Overvalued Without One Magic Ratio.
For informational purposes only. Not investment advice. QuarterlyIQ provides descriptive, rules-based analysis of company fundamentals and does not recommend buying or selling any security.