How to Read an Earnings Report
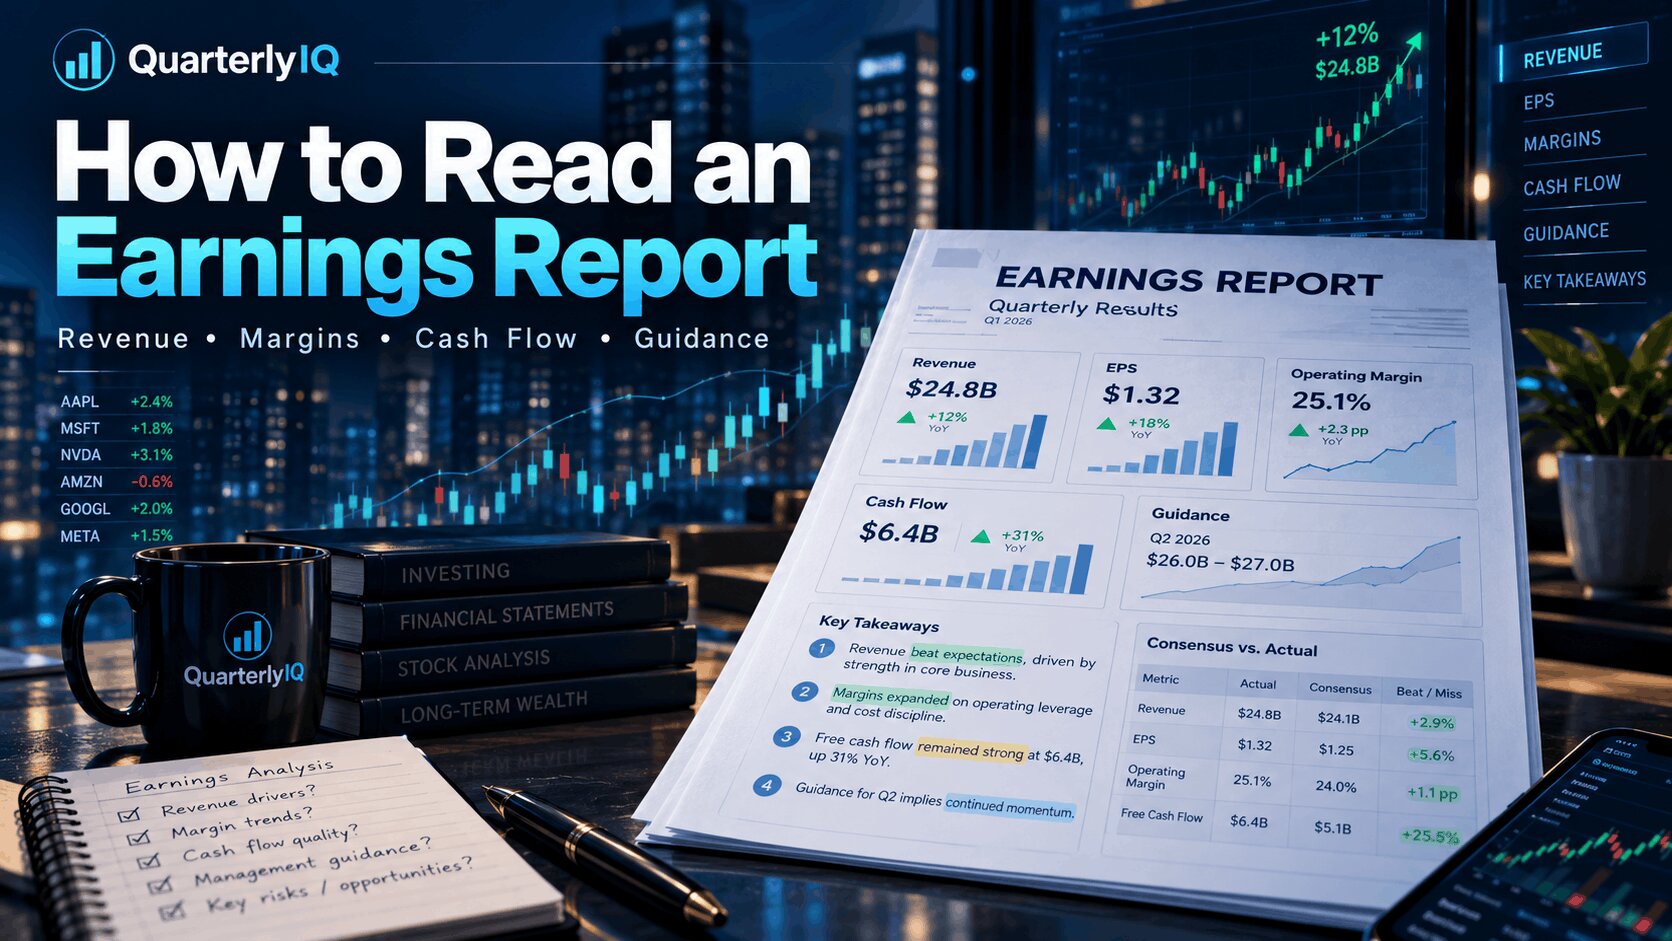
An earnings report is one of the most important updates investors receive from a public company.
It is also one of the easiest to misread.
Many investors focus on two numbers first:
Revenue.
Earnings per share.
Those numbers matter, but they rarely tell the full story.
A company can beat earnings estimates and still disappoint investors. It can miss earnings estimates and still reassure the market. It can report strong revenue growth while margins weaken, cash flow declines, or guidance raises new questions.
Reading an earnings report well means looking beyond the headline numbers.
The goal is to understand what changed in the business, what changed in expectations, and what changed in the investment thesis.
What is an earnings report?
An earnings report is a company update that usually includes recent financial results, management commentary, key operating metrics, and guidance about future performance.
Public companies typically report earnings each quarter and after the end of the fiscal year.
An earnings report may include several related materials:
- Earnings press release
- Financial statements
- Management commentary
- Shareholder letter
- Earnings presentation
- Guidance or outlook
- Conference call transcript
- SEC filing, such as a 10-Q or 10-K
The press release is usually the fastest summary.
The SEC filing is usually more detailed.
The conference call often explains what management wants investors to focus on.
A strong earnings review uses all three: the numbers, the context, and the explanation.
Why earnings reports matter
Earnings reports matter because they update the evidence behind an investment thesis.
They show whether the business is growing, whether margins are improving or weakening, whether cash flow supports earnings, whether customers are still spending, and whether management’s outlook has changed.
An earnings report can help investors answer questions such as:
- Is revenue growing for the right reasons?
- Are margins improving or under pressure?
- Is earnings growth supported by cash flow?
- Is guidance improving or weakening?
- Are estimates likely to move higher or lower?
- Is management executing on prior commitments?
- Is the company becoming more or less fragile?
- Does the original thesis still hold?
The purpose is not to react emotionally to one quarter.
The purpose is to decide whether the evidence still supports the reason you own or are researching the stock.
Start with expectations, not just results
The first mistake many investors make is reading the report in isolation.
A company’s results only make sense when compared with expectations.
The market usually reacts to the gap between what happened and what investors expected to happen.
A company can report strong growth and still fall if investors expected even stronger growth.
A company can report weak results and still rise if investors feared something worse.
Before reading the report, ask:
- What was the market expecting?
- What were analysts expecting?
- What did management guide for last quarter?
- What did the stock price already seem to assume?
- Was the stock priced for optimism, pessimism, or something in between?
- Which metric mattered most going into the report?
This context helps explain the market reaction.
For a deeper framework, read How to Read the Expectations Embedded in a Stock Price.
Step 1: Read the headline results, but do not stop there
The headline section of an earnings report usually highlights revenue, earnings per share, net income, margin performance, and sometimes adjusted results.
Start there, but treat the headline as a summary, not the conclusion.
Look for:
- Total revenue
- Revenue growth rate
- Gross margin
- Operating income
- Operating margin
- Net income
- Earnings per share
- Adjusted earnings per share
- Free cash flow
- Guidance updates
The headline numbers help you orient yourself.
They do not tell you whether the quarter was high quality.
A company can show strong adjusted earnings while cash flow weakens.
It can show revenue growth while pricing pressure builds.
It can show EPS growth because of share buybacks rather than stronger operations.
The first page tells you what management wants investors to notice.
The rest of the report helps you decide what matters.
Step 2: Check revenue growth
Revenue is often the first major signal.
It shows how much the company sold during the period.
But revenue growth should be broken down carefully.
Ask:
- How fast did revenue grow?
- Did growth accelerate or slow?
- Was growth organic or helped by acquisitions?
- Was growth driven by price, volume, new customers, or existing customers?
- Did currency changes help or hurt reported growth?
- Did one segment drive most of the growth?
- Was growth broad-based or concentrated?
- How does growth compare with guidance and expectations?
Not all revenue growth is equal.
A company growing because demand is strong may be in a better position than a company growing mostly because of price increases, acquisitions, or one-time factors.
A company can also grow revenue while the quality of growth weakens.
For example, growth may come with heavier discounts, higher customer acquisition costs, lower margins, or weaker cash conversion.
Revenue is the starting point.
The next question is whether the revenue is profitable, repeatable, and consistent with the thesis.
Step 3: Study margins
Margins show how efficiently a company turns revenue into profit.
The most common margins to review are:
- Gross margin
- Operating margin
- Net margin
- Adjusted operating margin
- Free cash flow margin
Gross margin shows how much profit remains after direct costs.
Operating margin shows profitability after operating expenses.
Net margin shows profit after all expenses, including taxes and interest.
Free cash flow margin shows how much cash the company generates relative to revenue.
Margin changes often reveal what the headline revenue number misses.
Ask:
- Are margins expanding or compressing?
- Is margin pressure temporary or structural?
- Are costs rising faster than revenue?
- Is pricing power improving or weakening?
- Is the company investing for growth?
- Are discounts or promotions affecting profitability?
- Are margins better or worse than management expected?
- Are adjusted margins very different from reported margins?
Margin expansion can support a stronger thesis.
Margin compression may signal pressure from costs, competition, mix shift, or weaker pricing power.
For more on this topic, read What Margin Compression Tells Investors.
Step 4: Compare GAAP and adjusted results
Many companies report both GAAP and adjusted results.
GAAP results follow standard accounting rules.
Adjusted results remove certain items that management believes do not reflect ongoing business performance.
Adjusted numbers can be useful.
They can also hide important costs.
Common adjustments may include:
- Stock-based compensation
- Restructuring costs
- Acquisition-related expenses
- Impairment charges
- Legal settlements
- One-time gains or losses
- Currency impacts
- Non-cash charges
The key question is whether the adjustments are truly unusual.
If a company repeatedly excludes the same type of cost every quarter, investors should be careful about treating it as temporary.
Ask:
- Are adjusted earnings much higher than GAAP earnings?
- Are the adjustments recurring?
- Are excluded costs part of normal business operations?
- Does cash flow support the adjusted profit number?
- Is stock-based compensation meaningful?
- Is management relying heavily on adjusted metrics?
Adjusted results should clarify the business.
They should not replace judgment.
Step 5: Review earnings per share carefully
Earnings per share, or EPS, tells investors how much profit is attributable to each share.
EPS is important, but it can move for several reasons.
EPS can increase because:
- Revenue grew
- Margins improved
- Costs declined
- Interest expense fell
- Taxes were lower
- Share count declined from buybacks
- One-time gains helped results
EPS can decline because:
- Revenue slowed
- Margins compressed
- Costs rose
- Interest expense increased
- Taxes were higher
- Share count increased
- One-time charges hurt results
Do not treat EPS as a single clean signal.
Ask what drove it.
A company with modest revenue growth and strong EPS growth may be improving efficiency.
It may also be benefiting from buybacks, tax changes, or temporary cost controls.
A company with strong revenue growth and weak EPS may be investing heavily, facing margin pressure, or struggling to scale profitably.
EPS matters most when you understand what created it.
Step 6: Read the cash flow statement
Cash flow is one of the most important parts of an earnings report.
Reported earnings can be affected by accounting assumptions.
Cash flow helps show whether the business is actually generating cash.
Focus on:
- Operating cash flow
- Capital expenditures
- Free cash flow
- Working capital changes
- Cash conversion
- Debt repayment
- Share repurchases
- Dividends
Free cash flow is often calculated as operating cash flow minus capital expenditures.
A company with strong earnings but weak cash flow deserves closer review.
Ask:
- Is cash flow improving or weakening?
- Does free cash flow support reported earnings?
- Are receivables rising faster than revenue?
- Is inventory building?
- Are payables changing in a way that temporarily helps cash flow?
- Is the company spending heavily to support growth?
- Is cash flow seasonal?
- Is cash flow enough to fund debt, dividends, and buybacks?
Cash flow can confirm an earnings story.
It can also challenge it.
For long-term investors, a business that converts earnings into cash consistently is usually easier to trust than one that only looks profitable on paper.
Step 7: Check the balance sheet
The balance sheet shows the company’s financial position.
It helps investors understand whether the business has enough flexibility to manage slower growth, higher rates, weak demand, or unexpected shocks.
Review:
- Cash and equivalents
- Short-term investments
- Debt
- Net debt
- Interest expense
- Accounts receivable
- Inventory
- Goodwill and intangible assets
- Shareholders’ equity
- Current assets and current liabilities
Ask:
- Is the balance sheet stronger or weaker than last quarter?
- Is debt increasing or decreasing?
- Can the company cover interest payments comfortably?
- Is cash sufficient for current needs?
- Are inventories building too quickly?
- Are receivables rising faster than sales?
- Are there signs of financial stress?
- Does the company have flexibility to keep investing?
A strong balance sheet can give management room to act.
A weak balance sheet can turn a temporary business setback into a larger investment risk.
Step 8: Review segment results
Many companies operate multiple business lines.
The total company result may hide important differences underneath.
A company can report stable revenue while one segment grows quickly and another weakens.
A company can show margin improvement because a high-margin segment is growing faster than a low-margin segment.
Segment analysis helps investors see what is really driving the business.
Ask:
- Which segments grew fastest?
- Which segments slowed?
- Which segments are most profitable?
- Which segments are losing money?
- Did segment mix help or hurt margins?
- Is one segment carrying the company?
- Are weaker segments temporary problems or structural concerns?
- Which segment matters most to the investment thesis?
The segment that matters most is not always the largest.
Sometimes the most important segment is the fastest growing, highest margin, or most strategically important part of the business.
Step 9: Pay attention to key operating metrics
Many companies report operating metrics that are specific to their business model.
Examples include:
- Subscribers
- Active users
- Customer retention
- Net revenue retention
- Average revenue per user
- Same-store sales
- Orders
- Backlog
- Bookings
- Units sold
- Gross merchandise volume
- Assets under management
- Loan growth
- Credit losses
- Occupancy
- Churn
- Customer acquisition cost
These metrics can be more useful than the income statement alone.
They often show what is happening beneath the financial results.
For example, a software company may report strong revenue growth while retention weakens.
A retailer may report revenue growth while traffic declines and promotions rise.
A bank may report earnings growth while credit quality deteriorates.
An industrial company may report strong sales while orders slow.
Operating metrics help investors understand whether current results are sustainable.
Step 10: Read guidance closely
Guidance is management’s outlook for future performance.
It may include expectations for revenue, EPS, margins, cash flow, capital spending, or other key metrics.
Guidance often matters more than the latest quarter because stock prices are forward-looking.
Ask:
- Did management raise, lower, or maintain guidance?
- Was the change expected?
- Which metric changed most?
- Is guidance conservative or aggressive?
- What assumptions does guidance depend on?
- Does guidance imply acceleration or deceleration?
- Are margins expected to improve or weaken?
- Does guidance support the investment thesis?
A company can beat quarterly results but lower guidance.
That may concern investors because the future outlook weakened.
A company can miss quarterly results but maintain or raise guidance.
That may reassure investors if the issue appears temporary.
Guidance helps investors understand the path ahead.
Step 11: Compare results with analyst estimates
Analyst estimates are not perfect, but they provide a useful benchmark.
Compare reported results with expectations for:
- Revenue
- EPS
- Gross margin
- Operating margin
- Free cash flow
- Guidance
- Segment performance
- Key operating metrics
The market reaction often depends on both the results and the implied change to future estimates.
Ask:
- Did the company beat or miss expectations?
- Was the beat broad or narrow?
- Did guidance imply estimates may move higher or lower?
- Were estimate revisions already happening before the report?
- Did management commentary confirm or challenge consensus expectations?
The most important issue is not simply whether the company beat estimates.
The question is whether the report makes the future path look better, worse, or roughly unchanged.
For more on this, read What Estimate Revisions Say About a Company.
Step 12: Listen to management commentary
Management commentary adds context to the numbers.
It can explain why growth changed, why margins moved, where demand is strong or weak, and how management sees the future.
Pay attention to comments about:
- Demand trends
- Customer behavior
- Pricing
- Competition
- Hiring
- Cost control
- Supply chain
- Inventory
- Product adoption
- Capital spending
- Regulatory issues
- Macro conditions
- Long-term strategy
Also compare management’s tone with prior quarters.
Ask:
- Is management more confident or more cautious?
- Are they explaining problems clearly?
- Are they changing the story?
- Are they blaming outside factors repeatedly?
- Are they specific or vague?
- Are they addressing the key investor concern directly?
- Are they following through on prior commitments?
Good management commentary should help investors understand what is changing.
Vague commentary may create more questions than answers.
Step 13: Read the earnings call transcript
The earnings call can be especially useful because analysts ask questions after prepared remarks.
The question-and-answer section often reveals what investors are most concerned about.
Focus on:
- Questions analysts ask repeatedly
- Topics management avoids
- Changes in tone
- Specific explanations
- Guidance assumptions
- Competitive concerns
- Margin pressure
- Customer demand
- Capital allocation
- Long-term targets
The prepared remarks show what management wants to emphasize.
The Q&A helps reveal where the pressure points are.
If analysts keep asking about margins, then margins may be the key issue.
If they focus on demand, the market may be worried about growth.
If they focus on cash flow, investors may not fully trust reported earnings.
The call helps identify the real debate.
Step 14: Separate temporary issues from structural issues
Not every negative item in an earnings report is thesis-changing.
Some problems are temporary.
Others may be structural.
Temporary issues may include:
- Short-term supply disruption
- One-time restructuring cost
- Seasonal weakness
- Currency headwind
- Temporary inventory adjustment
- Delayed customer orders
- Short-term spending increase
Structural issues may include:
- Persistent market share loss
- Long-term margin pressure
- Declining customer retention
- Rising competition
- Weakening pricing power
- Product relevance issues
- Repeated execution misses
- Balance-sheet stress
The distinction matters.
A temporary issue may not change the thesis.
A structural issue may require a deeper review.
Ask:
- Has this problem appeared before?
- Is it getting better or worse?
- Did management provide a credible explanation?
- Does it affect long-term growth, margins, or cash flow?
- Does it change the reason investors own the stock?
The most important earnings question is often not “Was the quarter good or bad?”
It is “Did the quarter change the long-term story?”
Step 15: Reconnect the report to the investment thesis
An earnings report should always be read against the investment thesis.
If the thesis was based on revenue acceleration, did revenue accelerate?
If the thesis was based on margin expansion, did margins improve?
If the thesis was based on customer retention, did retention stay strong?
If the thesis was based on a turnaround, did the turnaround progress?
If the thesis was based on free cash flow, did cash generation improve?
A useful thesis review asks:
- What evidence supported the thesis this quarter?
- What evidence challenged the thesis?
- What changed compared with last quarter?
- What changed compared with management’s prior guidance?
- What changed compared with market expectations?
- What needs to be watched next?
This keeps the earnings review focused.
Without a thesis, every number can feel equally important.
With a thesis, you know which evidence matters most.
For more on thesis monitoring, read How to Know When an Investment Thesis Is Weakening.
Step 16: Understand the stock reaction
After earnings, a stock may rise or fall sharply.
Do not assume the reaction tells the whole story.
A stock can fall after good results if expectations were too high.
A stock can rise after weak results if expectations were too low.
A stock can move because of guidance, margins, cash flow, segment results, estimate revisions, or management commentary.
Ask:
- Did the reaction match the headline results?
- Was the move driven by company-specific news or the broader market?
- Which metric appeared to matter most?
- Did guidance change expectations?
- Did analysts revise estimates afterward?
- Did the valuation become more or less demanding?
- Did the report change the thesis?
The stock reaction is a clue.
It is not the full answer.
For more on this concept, read What Does “Priced In” Mean in the Stock Market?.
A practical earnings report checklist
Use this checklist when reviewing an earnings report.
Revenue
- Did revenue grow or decline?
- Did growth accelerate or slow?
- Was growth organic?
- Which segments drove the result?
- Did revenue beat or miss expectations?
Margins
- Did gross margin improve or weaken?
- Did operating margin improve or weaken?
- Were margin changes expected?
- Are costs rising faster than revenue?
- Are margins consistent with the thesis?
Earnings
- Did EPS beat or miss expectations?
- What drove the change in earnings?
- Are adjusted earnings very different from GAAP earnings?
- Did share count affect EPS?
Cash flow
- Is operating cash flow improving?
- Is free cash flow positive?
- Does cash flow support earnings?
- Are working capital changes helping or hurting?
Balance sheet
- Is debt increasing or decreasing?
- Is cash sufficient?
- Are receivables or inventory rising too quickly?
- Does the company have financial flexibility?
Guidance
- Did management raise, lower, or maintain guidance?
- What assumptions support the outlook?
- Does guidance imply estimates may move?
Management commentary
- Is management confident or cautious?
- Are explanations specific?
- Did the story change?
- Did management address investor concerns?
Thesis
- What supported the thesis?
- What challenged the thesis?
- What changed since the last report?
- What needs to be monitored next?
Common mistakes when reading earnings reports
Focusing only on EPS
EPS matters, but it does not explain the full business.
A company can beat EPS because of cost cuts, buybacks, tax benefits, or temporary items.
Always ask what drove the result.
Ignoring cash flow
Earnings without cash flow deserve scrutiny.
Strong free cash flow can support the quality of earnings.
Weak cash flow can challenge it.
Treating all beats as good news
A beat only matters relative to expectations.
If the market expected a larger beat or stronger guidance, the stock may still fall.
Treating all misses as bad news
A miss may already be priced in.
If guidance improves or key metrics stabilize, the stock may rise.
Ignoring guidance
Guidance often matters more than the reported quarter because stocks are forward-looking.
Missing segment weakness
Total company numbers can hide problems in key segments.
Always look beneath the consolidated result.
Ignoring the investment thesis
Without a thesis, investors may react to every number.
The thesis helps identify which evidence matters most.
Overreacting to one quarter
One quarter can matter, but it rarely tells the whole story by itself.
Look for patterns across multiple reports.
For more on this, read Why One Quarter Rarely Tells the Whole Story.
Red flags in an earnings report
Some earnings reports raise more serious concerns.
Potential red flags include:
- Revenue growth slowing faster than expected
- Margins compressing without a clear explanation
- Cash flow weakening while earnings look strong
- Repeated guidance cuts
- Rising debt with weaker profitability
- Inventory building faster than sales
- Receivables rising faster than revenue
- Heavy reliance on adjusted earnings
- Large recurring “one-time” adjustments
- Management becoming vague or defensive
- Estimate revisions moving lower
- Key customer or segment weakness
- Competitive pressure affecting pricing
- Buybacks masking weak earnings growth
A red flag does not automatically mean the thesis is broken.
It means the investor should look more closely.
The concern grows when several red flags point in the same direction.
Green flags in an earnings report
Positive signs can also appear beneath the headline.
Potential green flags include:
- Revenue growth accelerating for clear reasons
- Margins improving with scale
- Free cash flow growing faster than earnings
- Guidance raised for fundamental reasons
- Customer retention improving
- Demand broadening across segments
- Management following through on prior commitments
- Debt declining while profitability improves
- Estimates likely moving higher
- New products gaining measurable traction
- Operating expenses becoming more efficient
- Pricing power holding up
- Business strength appearing across multiple metrics
A good earnings report is not just one strong number.
It is a report where multiple pieces of evidence support the same positive story.
How to read earnings across different business types
Different companies require different earnings focus areas.
Software companies
Focus on revenue growth, recurring revenue, retention, gross margin, operating margin, free cash flow, and customer acquisition efficiency.
Retailers
Focus on same-store sales, traffic, average ticket, inventory, gross margin, promotions, and guidance.
Banks
Focus on net interest income, credit quality, deposits, loan growth, charge-offs, capital ratios, and interest-rate sensitivity.
Industrials
Focus on orders, backlog, revenue growth, operating leverage, margins, supply chain, and capital spending.
Consumer companies
Focus on volume, pricing, gross margin, brand strength, inventory, and consumer demand.
Semiconductor companies
Focus on revenue by end market, inventory cycles, gross margin, customer concentration, capital spending, and guidance.
Energy companies
Focus on production, realized prices, costs, capital discipline, free cash flow, debt, and shareholder returns.
The right questions depend on the business model.
A good earnings review starts with understanding what drives the company.
How earnings reports connect to valuation
Earnings reports influence valuation because they update expectations.
A company may deserve a higher valuation if earnings show:
- More durable growth
- Better margins
- Stronger cash flow
- Lower risk
- Better execution
- Higher future estimates
A company may deserve a lower valuation if earnings show:
- Slower growth
- Margin pressure
- Weak cash flow
- Higher risk
- Poorer execution
- Lower future estimates
Valuation is not separate from earnings.
Earnings reports are one of the main ways investors learn whether the current valuation is becoming easier or harder to justify.
For a broader valuation framework, read How to Tell if a Stock Is Overvalued Without One Magic Ratio.
How earnings reports connect to portfolio monitoring
Reading one earnings report is useful.
Monitoring earnings across a portfolio is harder.
Each holding may have a different thesis, business model, valuation, and key metric.
One stock may depend on margin expansion.
Another may depend on customer growth.
Another may depend on a turnaround.
Another may depend on estimate revisions.
Another may depend on cash flow and balance-sheet strength.
That is why investors should track earnings through the lens of each holding’s thesis.
Across a portfolio, ask:
- Which companies strengthened their thesis?
- Which companies weakened their thesis?
- Which companies raised guidance?
- Which companies lowered guidance?
- Which companies showed margin pressure?
- Which companies improved cash flow?
- Which stocks became more fragile?
- Which risks need follow-up before the next report?
Earnings season is not just a series of isolated events.
It is a portfolio monitoring process.
For a broader monitoring framework, read How to Monitor a Stock After You Buy It.
How QuarterlyIQ approaches earnings reports
QuarterlyIQ helps investors connect earnings results to the investment thesis.
For covered companies, we focus on questions such as:
- What changed in the business?
- What changed in expectations?
- What changed in valuation?
- Did revenue, margins, cash flow, and guidance support the thesis?
- Did management commentary change the story?
- Are estimates likely improving or weakening?
- What evidence should investors watch next?
The purpose is not to predict the next price move or issue a buy, hold, or sell rating.
It is to help investors understand whether the company’s latest results support, challenge, or change the reason the stock matters in a portfolio.
Explore the QuarterlyIQ stock research section to review covered companies.
How to read an earnings report in 15 minutes
If you only have 15 minutes, use this process.
Minutes 1 to 3: Read the headline summary
Look at revenue, EPS, margins, cash flow, and guidance.
Minutes 4 to 6: Compare with expectations
Check whether results and guidance were better or worse than expected.
Minutes 7 to 9: Review margins and cash flow
Ask whether profit quality improved or weakened.
Minutes 10 to 12: Read management commentary
Look for changes in demand, pricing, competition, costs, and outlook.
Minutes 13 to 15: Revisit the thesis
Ask what changed, what matters next, and whether the report supports or challenges the original reason for owning or researching the stock.
This quick review will not answer everything.
But it can help you focus on the right issues before going deeper.
Frequently asked questions about reading earnings reports
What is the most important part of an earnings report?
The most important part depends on the company and the investment thesis. For many investors, the key areas are revenue growth, margins, cash flow, guidance, and management commentary.
Is EPS the same as profit?
EPS is profit per share, but it does not tell the full story. EPS can be affected by share count, one-time items, accounting adjustments, taxes, and other factors.
Why can a stock fall after beating earnings?
A stock can fall after beating earnings if the beat was already expected, guidance disappointed, margins were weak, or the stock was priced for even stronger results.
Why can a stock rise after missing earnings?
A stock can rise after missing earnings if investors feared worse results, guidance was reassuring, cash flow was strong, or a major uncertainty was resolved.
Should investors focus more on revenue or earnings?
Both matter. Revenue shows demand, while earnings show profitability. The right focus depends on the company’s stage, business model, valuation, and thesis.
Why is cash flow important in an earnings report?
Cash flow helps show whether reported earnings are supported by actual cash generation. Strong earnings with weak cash flow may require closer review.
What does guidance mean in an earnings report?
Guidance is management’s outlook for future performance. It may include expected revenue, earnings, margins, cash flow, or other key metrics.
How do earnings reports affect valuation?
Earnings reports update expectations about growth, margins, cash flow, and risk. Those updates can make a valuation look more reasonable, more demanding, or less supported.
The takeaway
An earnings report is not just a scorecard.
It is an update on the business, the expectations, and the investment thesis.
To read an earnings report well, look beyond the headline revenue and EPS numbers.
Study revenue quality, margins, cash flow, guidance, balance sheet strength, segment results, operating metrics, management commentary, and the market’s expectations going into the report.
Most importantly, connect the report to the thesis.
Ask:
- What changed?
- What matters?
- What was expected?
- What surprised investors?
- What evidence supports the thesis?
- What evidence challenges it?
- What should be watched next?
A strong earnings review does not require predicting the next stock move.
It requires understanding whether the business is still moving in the direction the investment case requires.
For more on expectations and earnings reactions, read What Does “Priced In” Mean in the Stock Market?.
For a broader portfolio monitoring framework, read How to Monitor a Stock After You Buy It.
For informational purposes only. Not investment advice. QuarterlyIQ provides descriptive, rules-based analysis of company fundamentals and does not recommend buying or selling any security.