Introducing QuarterlyIQ Workspace: Compare the Numbers, Keep the Context
A new place to compare stocks, ETFs, and funds, graph the same metric, and keep your questions and cited answers beside the evidence.
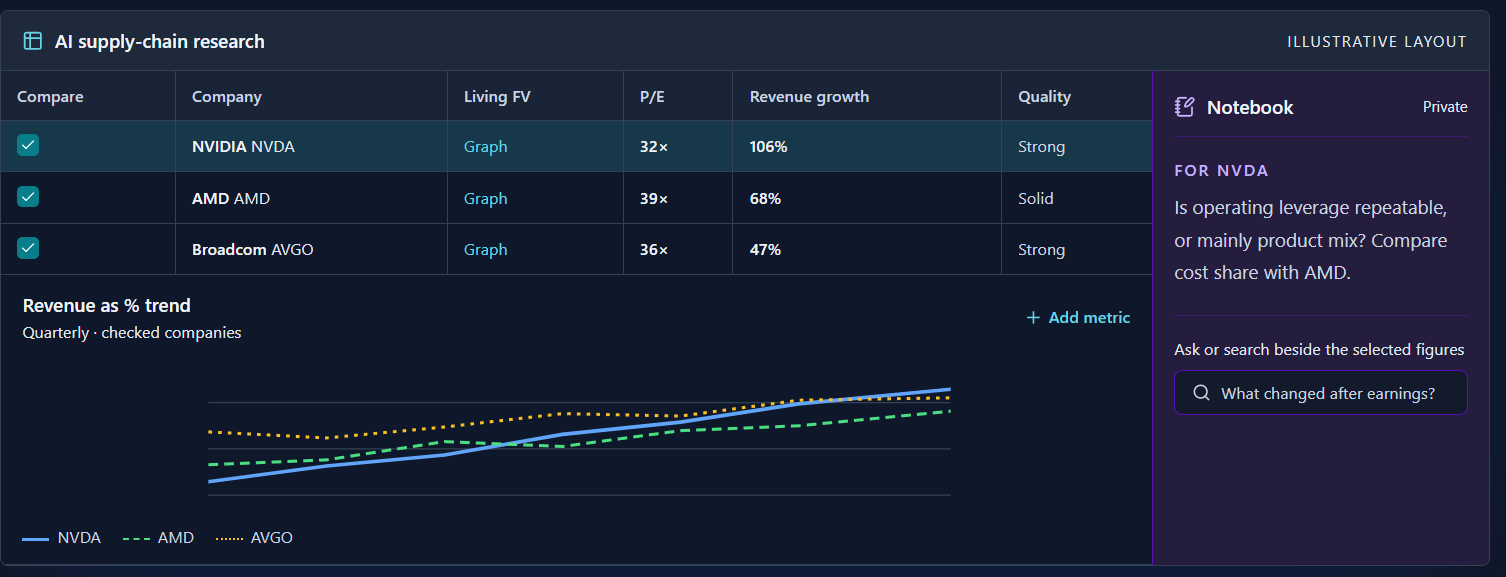
At QuarterlyIQ, we are always looking for ways to make investing easier and more transparent for individual investors.
Today, we are introducing a new tool called Workspace. We believe Workspace will make it easier to research investments, take notes, compare stocks with one another, and keep the information that matters in one place.
A company Report can answer a lot of questions about one stock, but real research rarely ends there. You want to put the company beside its peers, see whether a trend is company-specific or industry-wide, compare its valuation with the holdings you already own, and record the question you want to revisit later.
Workspace brings comparison tables, charts, Research Sets, portfolio context, and a Notebook together so the numbers and your thinking stay in the same place.
With Workspace, you can
- Compare securities side by side. Build a Research Set with covered stocks, ETFs, and mutual funds, or work from a portfolio or your Watching list.
- Graph the same metric across companies. Select the names you want to compare, click a metric, and switch between quarterly or annual views. For supported financial metrics, compare the reported value or view it as a percentage of revenue.
- Keep the thinking beside the evidence. Use the Notebook for notes, questions, and source links without leaving the figures you are studying.
- Ask or search from the Notebook. Ask about the figures on screen, search the web with linked sources, and save useful answers to your notes.
- Bring a Research Set to Home. Add a compact Workspace card to your Home page for a daily glance, then open the full Workspace when you are ready to dig in.
Build a Research Set around a real question
A watchlist tells you which securities you are following. A Research Set gives that list a purpose.
You might create a set for AI infrastructure, regional banks, dividend candidates, or the companies competing for the same customer. You can add covered stocks, ETFs, and mutual funds, arrange the set in the order that makes sense to you, and hide sets you are not actively using.
You can also work from a portfolio or your Watching list. Manual holdings can include shares and average cost. Holdings imported from a brokerage remain read-only in Workspace, preserving the brokerage record while still giving you a place to compare and analyze them.
Compare the same evidence
Most comparisons break down because the figures are collected from different pages, measured over different periods, or defined differently.
Workspace keeps the comparison explicit. Choose the securities you want in the chart, click a metric in the table, and graph that same reported metric below. Use quarterly or annual periods and adjust the date range. For supported financial metrics, switch between the reported value and the figure as a percentage of revenue.
The chart uses distinct colors and line styles so overlapping series remain readable. Unsupported metrics are shown as unavailable rather than filled with an estimate.
This makes it easier to ask better questions:
- Is revenue growth broadening across the group or concentrated in one company?
- Is a rising cost line actually becoming smaller relative to revenue?
- Does a valuation gap reflect different fundamentals, or simply different expectations?
- Is a change persistent across quarters or just one noisy period?
Workspace does not answer those questions with a blended score. It helps you place the evidence side by side and see the differences.
Keep the Notebook beside the numbers
Research becomes more useful when you can preserve why a number mattered.
The Workspace Notebook stays beside the table and chart. Add notes, record questions, save source links, and organize those entries without leaving the research view. The Notebook can be hidden when you want more room and reopened from the same place when you need it. On a phone, it opens as a dedicated drawer so the Notebook remains accessible without crowding the table.
There are two ways to go further:
- Ask uses the figures currently on screen as context. It can explain the comparison, connect it to available QuarterlyIQ research, and cite the figures used in the answer.
- Search finds relevant information on the web and returns linked sources you can inspect. Useful answers and sources can be saved back to your notes.
We have also expanded the Portfolio Assistant so it can work with more of the research already in QuarterlyIQ, including valuation, what is priced in, peers, analyst calls, and dividends.
These tools are designed to help you investigate. They do not place trades, alter brokerage holdings, or turn an uncertain estimate into a recommendation.
Customize the information you see first
Workspace is where you do the work. Home should help you decide where to focus.
You can now customize your QuarterlyIQ Home page so the site opens with the information most relevant to you. Choose the cards you want to see, arrange them to fit your routine, and add a compact Workspace card with a specific Research Set.
That card gives you a quick daily view, then takes you into the full Workspace when you want to compare, chart, or add context. It is a doorway into the work, not a second copy of the entire Workspace.
Research and Workspace have different jobs
We also simplified the way these areas fit together:
- Research is where you discover and screen securities.
- Workspace is where you organize a set, compare the evidence, and preserve your thinking.
- Portfolio is where you monitor the investments you own.
- Home is the daily overview that helps you choose what deserves attention.
When you find a company in Research, you can add it to the Research Set you are already working on instead of starting over with a one-company list.
How to get started
- Sign in and open Workspace from the main navigation.
- Create a Research Set, open a portfolio, or use your Watching list.
- Add the securities you want to study.
- Check the companies you want to compare, then click a table metric to graph it.
- Open the Notebook to add a question, ask about the visible figures, or search for supporting sources.
- Save the Research Set to Home if you want a compact daily view.
Workspace is now available to all users.
QuarterlyIQ provides research for informational purposes only. It is not investment advice. Market data, company filings, third-party estimates, and valuation models may be incomplete, delayed, or wrong. Review the underlying evidence and make your own investment decisions.