A Beginner’s Guide to Reading the Economy Without the Jargon
A plain-English guide to inflation, GDP, jobs, interest rates, and the signals that shape markets.
Economic headlines often sound harder than they really are.
Part of that is the data. Most of it is not exactly written for normal humans. But part of it is also how the news talks about it. A simple update on prices or jobs gets dressed up like a riddle.
It does not have to be that way.
Most macro data is really trying to answer just a few basic questions: Are prices rising quickly or slowing down? Is growth holding up or fading? Are people working and spending? Is borrowing getting easier or harder? And what is the market starting to expect next?
Once you start reading the economy through those questions, the fog lifts pretty fast.
You do not need to know everything
A lot of investors think they need to memorize a dictionary of economic terms before they can understand markets.
They do not.
You do not need to become an economist. You need a small set of signals that help you judge the environment companies are operating in.
That matters because stocks do not trade in a vacuum. They trade inside an economy.
If growth is slowing, demand can weaken. If inflation stays sticky, costs and interest rates can stay high. If the job market starts to crack, consumer spending can soften. If borrowing stays expensive, some business models get a lot less comfortable.
The goal is not mastery of jargon.
The goal is a clear framework.
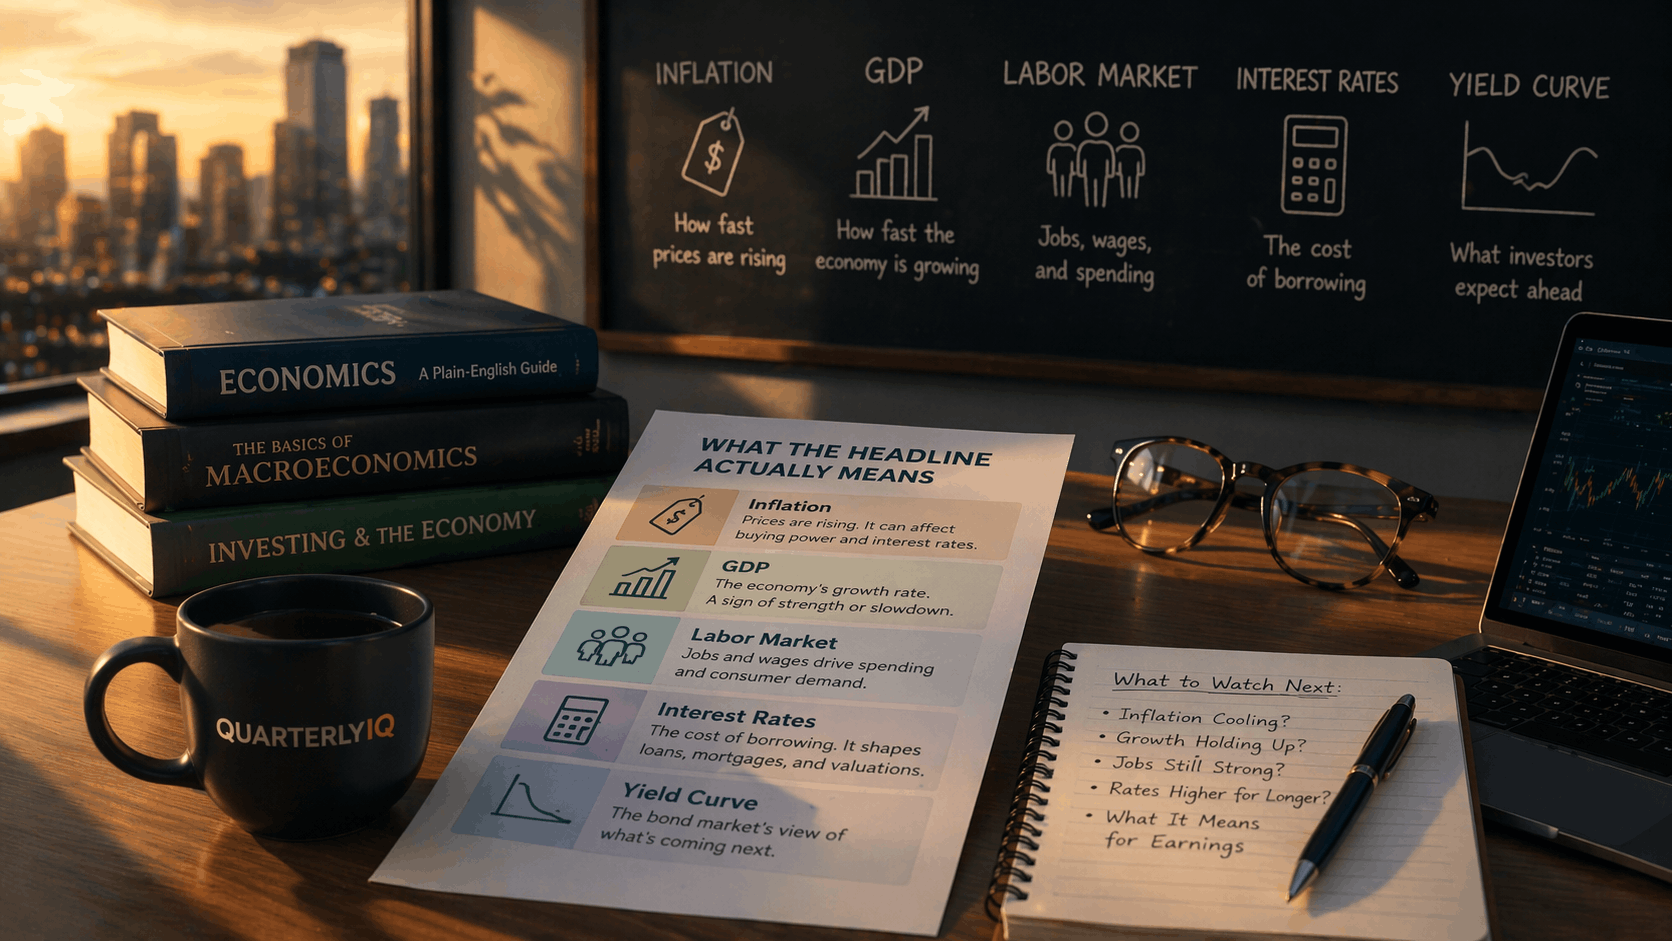
The five signals that matter most
1. Inflation
Inflation tells you how fast prices are rising.
Markets care because inflation affects a lot more than the price of groceries. It shapes company costs, consumer behavior, and what the Federal Reserve may do next.
If inflation stays high, the Fed may keep rates higher for longer. That can pressure borrowing, valuations, and margins. If inflation cools, some of that pressure can ease.
The key is not just whether inflation went up or down in one report. It is whether inflation is becoming more or less of a problem for the next quarter.
2. GDP
GDP tells you whether the economy is broadly growing or slowing.
It is not a scorecard for every company, and it does not tell the whole story by itself. But it does help investors understand the backdrop.
If growth is holding up, companies usually have more room to perform. If growth weakens, the market may start getting more cautious about demand, revenue, and earnings.
GDP matters most when it changes the tone of the environment, not when it simply fills a headline.
3. The labor market
Jobs data helps show whether the consumer is still standing on solid ground.
That includes hiring, wages, unemployment, and jobless claims. A healthy labor market usually supports spending. A weaker one can pressure confidence and demand.
That matters because the consumer sits underneath a huge part of the economy.
If people are working and incomes are steady, many businesses have a better shot at holding up. If labor starts to weaken, a lot of earnings stories can change faster than investors expect.
4. Interest rates
Rates are the cost of money.
They affect mortgages, business loans, credit cards, valuations, and overall risk appetite in the market.
Higher rates can pressure housing, consumer borrowing, and the parts of the stock market that benefited most from cheap money. Lower rates can ease some of that pressure.
But markets do not just react to where rates are today. They react to where investors think rates are going next. That is why rate expectations often matter as much as the actual rate decision.
5. Expectations
This is the signal many beginners miss.
Markets are always looking ahead. They care about what is happening now, but they care even more about what might happen next quarter.
That means a headline is never just a headline. It gets compared to what investors already expected.
A jobs report can look strong and still disappoint if markets were hoping for even more. An inflation report can still lift stocks if it is not as bad as feared. Expectations are the invisible layer sitting under almost every market move.
That is where QuarterlyIQ should help readers most: not just by explaining the data point, but by showing which signal matters, what may already be priced in, and what to watch next.
The mistake most people make
Most people treat economic headlines like isolated events.
They see one CPI report, one jobs report, or one GDP print and assume it tells the full story.
Usually, it does not.
Macro data makes more sense when you read it as a pattern. One report can be noisy. A trend is more useful. What matters is the direction, the consistency, and whether the data is improving, weakening, or staying mixed.
That is the difference between reacting to noise and actually reading the environment.
Four good questions to ask after any economic headline
When a macro release hits, you do not need a PhD. You just need a few good questions.
What does this report actually measure?
Is it improving, weakening, or mixed?
Which sectors or companies are most exposed?
What could this mean for the next quarter?
Those four questions will take you further than most jargon ever will.
Why this matters for investors
The economy is not just background information. It shapes the conditions companies report in.
That is why macro matters.
Not because every release demands a trade. And not because every number changes the story. Sometimes a headline is just a headline. Markets do enjoy overreacting before breakfast.
But over time, macro helps investors understand whether the broader backdrop is acting like a tailwind or a headwind.
That can make a big difference when you are trying to understand sectors, earnings setups, or why one group of stocks is suddenly working while another is struggling.
The takeaway
You do not need to memorize economic jargon to understand markets.
You need a simple framework.
Watch inflation. Watch growth. Watch jobs. Watch rates. And always pay attention to expectations.
Then ask what those signals may mean for businesses, sectors, and the quarter ahead.
That is when the economy starts to feel less confusing.
And a lot more useful.
Want help filtering the noise? Follow QuarterlyIQ for plain-English analysis on the economy, sectors, and stocks, and get notified when new breakdowns go live on Telegram: t.me/quarterlyiq